For years I've had an ongoing project to bring a reliable low-level debugger to RISC OS machines, not least for my own use because developing on RISC OS can be painfully frustrating. If you make mistakes in system extension code such as modules, vectors handlers and IRQ handlers then it's almost a certainty that the machine is going to become unusable and will have to be reset. Many times.
Over time I've built up a collection of small utilities that are helpful to me, and every so often I put another burst of effort into building a full debugger that brings all these bits of code together. Because of the amount of time this project has been brewing, Neil started referring to it as my 'Ultimate Debugger' project, and - for now at least, the name has stuck. (Although the code itself currently goes by the inspired name of !Debug)
The debugger consists of two parts -
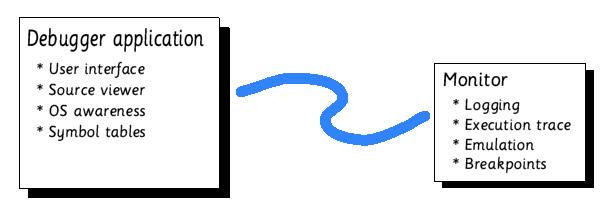
This allows the impact and footprint of the debugger on the target system to be kept small, and means that it can easily be modified for debugging other target systems. It is also intended that one day the debugger application be capable of using JTAG hardware to debug systems at an even lower level. In such a setup the debug monitor would be replaced with the JTAG interface and logic of the target CPU.
All of the following are intended to be included in the debugger. Also given for each is its current status.
Has been used to connect from the IYONIX pc to the RiscPC and study its memory contents, with a prototype debug monitor running on the RiscPC
See screenshot below. Currently renders windows and icons but has no input handling. The debugger core creates two copies of each window when it starts up, one with the RISC OS WindowManager and one with its own internal window manager. This allows it to operate as a normal desktop app when debugging remotely and when it's possible to use the RISC OS desktop, switching to its own window management using the second copy of each window when stepping through module code, for example.
The debugger is a very low-level piece of code that has fewer limitations than DDT and DeskDebug about when it can be used. It's perfectly possible to step through module code running in SVC mode, though the debugger does need to enable IRQs for its own operation (for keyboard/mouse input). Since the IYONIX pc has JTAG hardware it will hopefully be possible to remove even this limitation if you have another machine and suitable hardware handy.
Once partially working in a previous incarnation of the debugger; the current utilities can only install unconditional breakpoints, meaning that execution will be halted every time that the breakpoint is reached. This is less than helpful if you have to set a breakpoint in some code that is executed thousands of times and only fails on the last occasion.
By recording the context changed by each instruction it becomes possible to work out retrospectively, at the point of a failure, the state of each register and memory location for each of the preceding instructions, providing a trace of the dataflow prior to the failure; ie. when a data abort is raised, the debugger can show you from whence the invalid address originated.
Enabling this feature is likely to slow down the execution of the debuggee task considerably because it requires the use of an emulation technology akin to the ARM610 engine of Aemulor. It's likely to be at least 20 times slower than native execution even with the various optimisations that can be made.
It should be possible to validate every memory access to check that out-of-block accesses do not occur in malloc heaps, and unitialised local variables are not accessed; none of this has been implemented yet but could be achieved using an emulation technology akin to the StrongARM engine of Aemulor.
A common debugging technique is to record 'trace' statements from a program, showing the control flow through the program and recording salient information; this, in the continuing absence of a reliable debugger on RISC OS has really been the only way to debug programs.
I currently have a small module called DebugLog whose facilities are to be integrated into the debug monitor/debugger application and which currently provides such a tracing facility, recording the trace data into either a dynamic area or - on the IYONIX pc - the video memory of the NVIDIA card. The reason for doing the latter is that the NVIDIA card holds its memory contents over a reset (and indeed for many seconds after a power off!), making it invaluable for capturing trace data prior to a machine hang.
Currently available on the XScale CPU (ie. IYONIX pc) only, the DebugLog module mentioned above is capable of recording the instructions executed prior to the point of failure, with no slowdown at run-time (this is a hardware debug facility of the XScale core).
This code works, although its usability is currently restricted slightly by the need to convert the trace into ASCII form to log it; it's intended that the debugger should understand the XScale's trace data itself, allowing you to manually skip through the traced instructions much more fluidly.
Combined with the Dataflow recording proposed above, this should provide a convenient way to discover the register contents when each of the traed instructions executed, so that you can much more rapidly work out what induced the failure.
When running locally, the debugger provides a panic button (both Alt keys pressed together) which will suspend the execution of the debuggee, activating the debugger exactly as if an exception had occurred.
This means that when the machine hangs in an apparently infinite loop (even in SVC mode), you can hit the panic button and find out what it's doing.
A prototype execution profiler has been built using the emulation engines at the heart of Aemulor, combined with some simple profiling code that uses the XScale's CCNT register which can count CPU cycles. This profiling code has already been used to increase the performance of the Cino DVD player and the NetSurf web browser.
Prototype code is currently able to run through the stack picking out data that look like valid addresses; by matching up these addresses with some RISC OS-specific knowledge of module locations, it becomes possible to provide a backtrace of the threaded modules and, where symbol tables are available, the routines within those modules.
The debugger is able to parse symbol tables produced by the Acorn C/C++ link or GCC's drlink.
Where function names are embedded in the binaries (application and modules) these will, of course, be reported in the backtrace; the debugger should be capable of extracting these function names even when the frame pointer is invalid or the debugged code was built with the 'nofp' switch, by means of running back through the code from the saved return address until a function entry sequence and name signature is found. (Not yet implemented)
Other bits of prototype code are already capable of providing a dump of the extant dynamic areas, vector handlers, relocatable modules etc. and, at the same time, looking for corruption of that data where RISC OS itself would just crash, often rendering the machine unusable
These bits of code, too, will be integrated into the debugger application.
The screenshot captured below shows the debugger running in single-tasking mode for which it's not possible to call the RISC OS WindowManager. To this end, in a manner similar to DDT, the debugger has its own integrated window management code, display driver and mouse/keyboard handling.
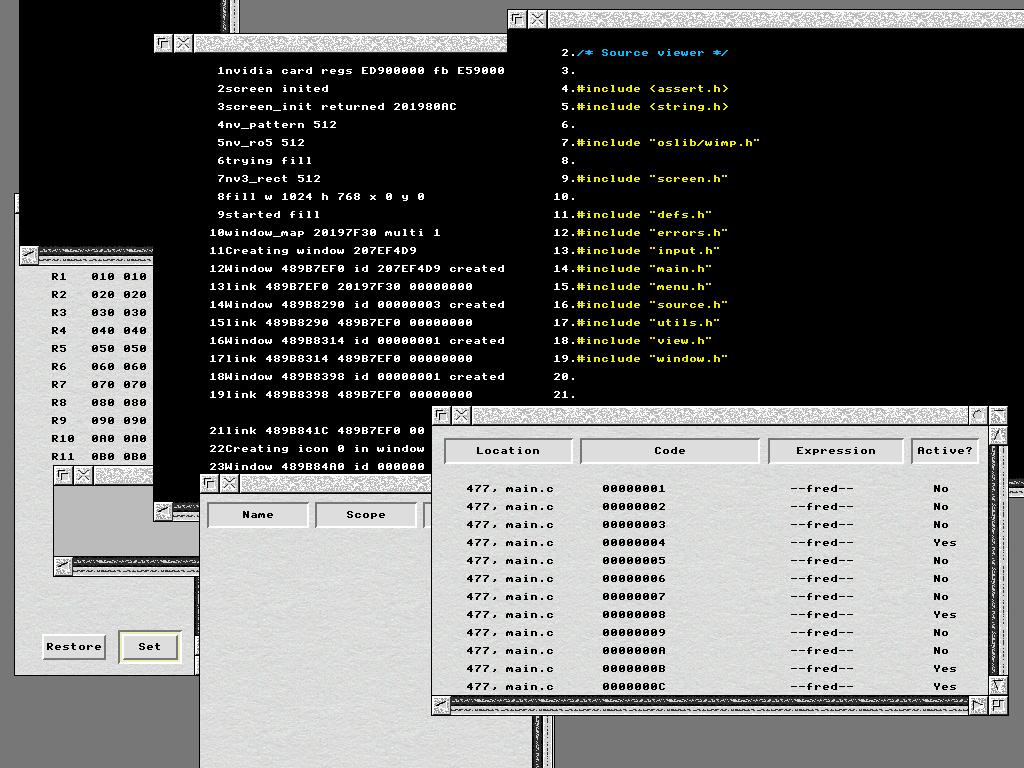 Click for full size version.
The above screen shows the debugger displaying its window via its own window management code (likely to be used in one or more other projects that are currently sat on back burners!), rendering its output to the third NVIDIA card in my IYONIX pc. RISC OS is not being used at all to generate that image; instead it is rendered using the NVIDIA-specific hardware acceleration code that has also found a home in Geminus, combined with my own sprite plotting code - now used in Geminus, with corrected palette handling (unlike the present screenshots here!) - line drawing, rectangle plotting and text rendering code that I've stolen from another of my projects
The debugger does not, of course, require the presence of a second graphics card for its operation, although it will be able to drive a screen of its own via the Geminus API when I've finalised that. It's anticipated that the debugger output will be directed at the YUV overlay facility of the NVIDIA card, allowing the debugger's windows to be displayed overlapping the output of the program being debugged. On non-IYONIX systems (or even non-NVIDIA graphics cards in the IYONIX pc, should such an event ever occur!) the debugger will resort to overlaying them in software in a manner similar to the way that DDT currently operates.
An earlier incarnation of the debugger ran on a RISC OS 3.7 StrongARM RiscPC - yes, that's how old the project is! - running full screen with its own IOMD keyboard driver, capturing and restoring the previous contents of the video memory. (In fact I also made a build that could drive a secondary screen via an homebrew ISA bus interface and an EGA card in my RiscPC, but that's another story.)
The XScale core has the ability to record a trace of the instructions that it has executed, and by dint of halting and capturing this trace information immediately after an exception is raised, it can provide a useful record of what happened immediately prior to the fault occurring, as shown below
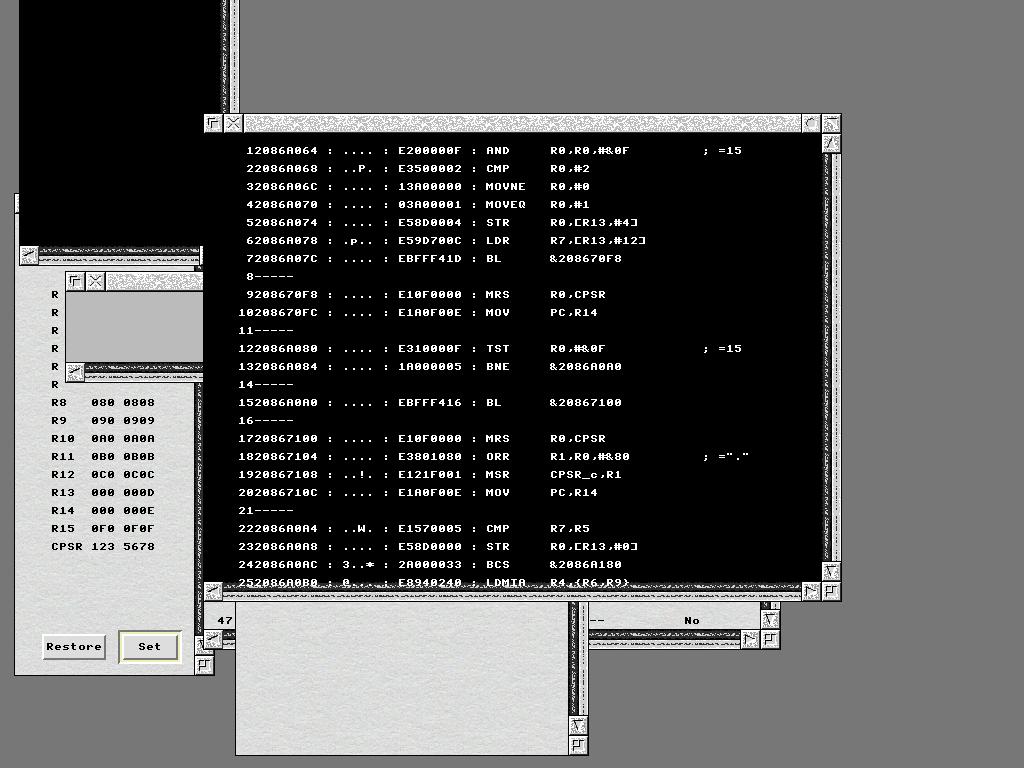 Click for full size version.
The debugger also runs as a normal desktop application, which is the only mode required when debugging a remote program on a second machine (and also the most useful, allowing you to use your other applications).
 Click for full size version.
The debugger-monitor protocol allows you to download code images for execution on the remote machine and to send/receive files, specifically so that symbol tables and even source code can be stored on the remote machine alongside the executable (to reduce the chance of any inconsistency between the binary and source). The debugger will be capable of retrieving those files as and when it needs them over the link.
Some of this functionality is available in a very basic form via a couple of RISC OS modules already uploaded to my webspace. Documentation is scant, however, and the modules have a few quirks. They could be useful in tracking down machine freezes and serious crashes that are otherwise very hard to locate, but I don't intend to support them.
I mention them here because it is likely to be some time before their functionality can be released as part of a full debugger.
![]() DebugLog
- A simple module that provides logging of text information
('program trace' information) from log_printf() calls within
an application or module.
DebugLog
- A simple module that provides logging of text information
('program trace' information) from log_printf() calls within
an application or module.
![]() ProfileMod
- This simple module provides profiling, or at least timing,
facilities. Its big weakness at the moment is that you have
to modify your application extensively to insert calls to start/
stop timing at the entry/exit of each (suspected) critical stage
of the application; you can't just pass an application/module
binary to the profiling tool and get a summary of where the
time is spent.
ProfileMod
- This simple module provides profiling, or at least timing,
facilities. Its big weakness at the moment is that you have
to modify your application extensively to insert calls to start/
stop timing at the entry/exit of each (suspected) critical stage
of the application; you can't just pass an application/module
binary to the profiling tool and get a summary of where the
time is spent.
The ProfileMod module is a very short handler for undefined instructions that makes the CCNT register of the XScale core accessible from USR mode as well as the protected modes. This allows the profiling code to operate in any processor mode. The application-linked code should be self-explanatory if you're experienced enough to be searching for profiling tools in the first place ;)
For those using GCC, John-Mark Bell has extended the simple profiling code in the above archive so that it can be used with the -finstrument-functions option of gcc. This gives an estimate of the total execution time spent within each function; I say an estimate because it does require that the source be recompiled with different compiler settings and it thus becomes a different program.
Whilst not as convenient or as accurate as running an unmodified binary under a profiling tool (which hopefully my debugger will one day allow), this is the best available tool for profiling RISC OS code at present. Click here to download, and thanks to John-Mark for letting me host this. As a point of interest, it is this code that has been used to tune NetSurf for increased performance.
Last Updated: 16th March 2006
Copyright © Adrian Lees 2005-6